

You already know your churn rate. What you do not know is why, and that is the number that actually moves the P&L. A churn rate tells you the size of the leak. It never tells you where the water is coming in. To fix churn you have to instrument it: split involuntary from voluntary, capture a structured reason at cancel, track the usage that predicts it, and interview the people who leave. Do that and one scary percentage turns into a ranked list of five or six real problems, most fixable this quarter. Here is the six-stage system, the exact copy to steal, and the ways it quietly breaks.
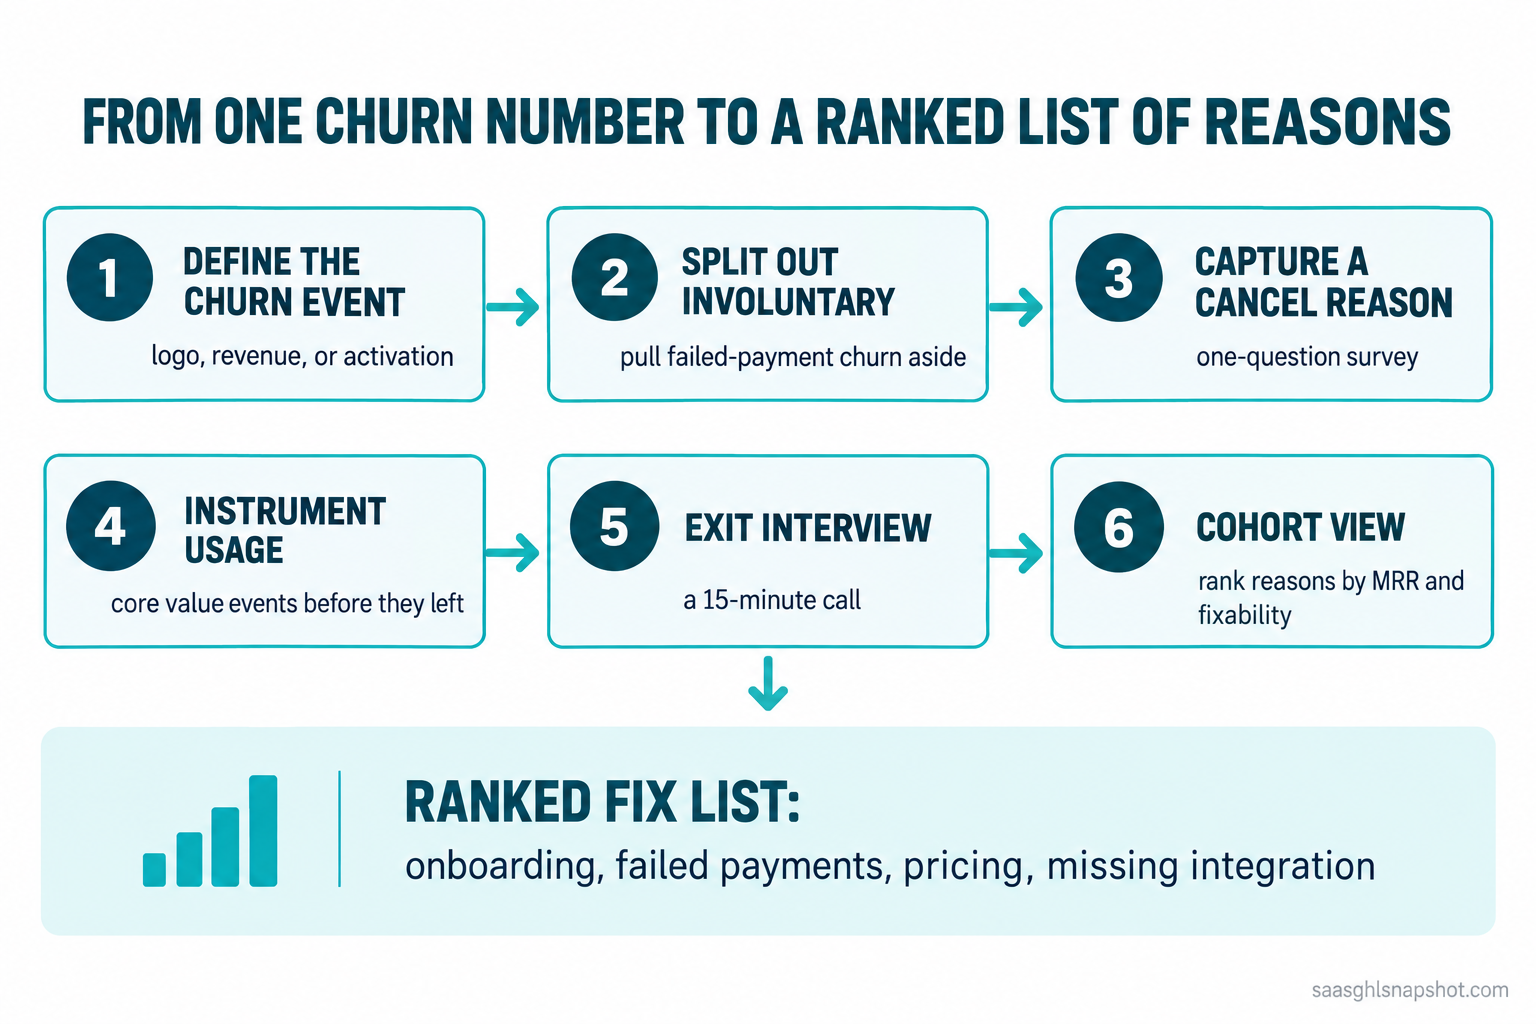
Table of contents
- The short answer: a churn rate is a symptom, not a diagnosis
- What a churn number with no reason actually costs you
- The six-stage instrumentation system
- Stage 1: Define the churn event precisely
- Stage 2: Split out involuntary churn first
- Stage 3: Capture a structured reason at cancel
- Stage 4: Instrument the usage that predicts it
- Stage 5: Run the exit interview
- Stage 6: Build the cohort view that ranks the fixes
- Three scenarios: solo, five-person, fifteen-person
- Instrumenting churn without breaking privacy law
- Objections
- The payoff
- FAQ
- Sources
The short answer: a churn rate is a symptom, not a diagnosis
Most early-stage SaaS teams measure churn the way a patient measures a fever. They know the temperature is high, and they have no idea what the infection is. So they throw tactics at it, a longer trial, a loyalty discount, a new onboarding email, and hope the number drops, with no idea which one worked.
Instrumenting churn means building a repeatable path from “we lost 14 accounts last month” to “nine stopped logging in by week three, three were failed cards we never retried, and two were missing one integration.” That second sentence is a work plan. The first is just anxiety. You do not need a data team or a warehouse, just the discipline to run six stages, most of it shippable in a week.
What a churn number with no reason actually costs you
Churn is the most expensive metric on your dashboard because it compounds. Median monthly SaaS churn stabilizes at 3 to 4 percent after product-market fit, and the top quartile runs 1 to 2 percent, per ChartMogul’s SaaS Benchmarks Report, 2023 edition. The gap looks small until you annualize it: 2 percent monthly keeps roughly 78 percent of customers across a year, 4 percent keeps about 61 percent. And churn decides whether growth is even possible, with SaaS Capital’s 2026 benchmarks putting median growth at just 22 percent (20 percent for bootstrapped firms) and Benchmarkit’s 2025 report showing net revenue retention at 101 percent and gross revenue retention down to 88 percent.
A chunk of that number is not a product problem at all. Failed payments were forecast to cost subscription businesses more than $129 billion in 2025, per Recurly, and involuntary churn, the cards that expire and decline, is an estimated 20 to 40 percent of total losses. Treat all your churn as “customers decided to leave” and you run the wrong play on a third of it. The reason, not the rate, is what you act on.
The six-stage instrumentation system
Churn instrumentation is a pipeline: each stage removes noise that would otherwise pollute the next, so run them in order.
| # | Stage | What it answers | Where it lives |
|---|---|---|---|
| 1 | Define the churn event | What counts as churn, and when | Billing + CRM |
| 2 | Split involuntary out | Did they leave, or did the card fail | Billing |
| 3 | Capture a cancel reason | What they say the reason is | Cancel flow |
| 4 | Instrument usage | What they did before they left | Product events |
| 5 | Exit interview | The real reason behind the stated one | A 15-minute call |
| 6 | Cohort view | Which reason is biggest and most fixable | A simple table |
Stage 1: Define the churn event precisely
Before you measure why, agree on what. “Churn” is three events wearing one word.
- Logo churn: the account cancels entirely. One customer, gone.
- Revenue churn: the account stays but downgrades. No lost logo, lost MRR.
- Activation churn: the trial never converts. Billing never sees it, but it is the biggest leak at most early-stage companies.
Pick the primary event and date it precisely. The cancel date is not the day the subscription lapses, it is the day they decided, usually weeks earlier. Record both decision_date and effective_date (when access ends); the gap between them is your save window.
How it breaks: teams define churn as “subscription ended this month” and fold failed payments, downgrades, and real cancellations into one bucket, so the reasons make no sense. Separate the types on day one.
Stage 2: Split out involuntary churn first
This is the highest-impact stage, often skipped as billing plumbing when it is retention. Involuntary churn, a customer who still wants your product but whose card expired or declined, is a fifth to two-fifths of the total and the most recoverable segment you have, because their card just needs to go through. So before you analyze a single “reason,” pull the failed-payment accounts out of the pile, tag them involuntary, and route them to a dunning sequence, not a win-back (the failed-payment dunning playbook covers the mechanics). Leave them unlabeled and they bloat your voluntary reasons as “unknown,” the one bucket you can least afford to misread.
How it breaks: keep recovered involuntary churn in its own column, so a payment gateway’s work never flatters your voluntary numbers.
Stage 3: Capture a structured reason at cancel
The cancel is the only moment a customer is guaranteed to tell you something, and most products waste it on a bare “Are you sure?” button. Put a one-question survey in the cancel flow: a short, fixed list so you can count it, plus a free-text box for what the list missed. Keep the options mutually exclusive and in the customer’s language.
Route those reasons to saves with the cancellation flow playbook; for instrumentation, the rule is simple: every cancel produces exactly one reason_code.
How it breaks: if options overlap, “too expensive” and “not enough value” split the same feeling and your top reason is an artifact of wording. Write them so only one fits.
Stage 4: Instrument the usage that predicts it
Stated reasons rationalize. The customer who says “too expensive” often means “I never used it enough to justify the price,” an adoption problem in a pricing costume. The only way to tell them apart is to look at what the account did before it left.
You do not need to track everything, just the three or four events that represent real value. Accounts rarely cancel out of nowhere; they go quiet weeks first. This is the signal that powers a churn prediction health score, but for diagnosis you only need one answer per churned account: were they using the product in the 30 days before they left? “Churned while active” and “churned while dormant” are completely different problems, and most teams cannot say which dominates.
How it breaks: you instrument forty events, drown in them, and still cannot answer the one question that matters. Or you track logins, which masks an account that stopped getting value. Track value, not presence.
Disclosure: the link above is our GoHighLevel affiliate link. We may earn a commission if you start a plan, at no extra cost to you.
Stage 5: Run the exit interview
The interview gives you the story behind the survey’s category, and the story is where the fix lives. You do not need many: five to eight real conversations a month surface patterns faster than a thousand survey rows, because a human can ask the follow-up a dropdown cannot. Reach out within a week while it is fresh, keep it to fifteen minutes, and say up front you are there to understand, not to win them back.
Log each interview against the same reason_code taxonomy as the survey, plus a one-line quote. Those quotes become the most persuasive internal document you own: “three customers used the same words about setup” lands harder than any chart.
How it breaks: the founder interviews only the angriest churned customers and builds a roadmap around a vocal edge case. Pull the list at random from all churns, not from the inbox.
Stage 6: Build the cohort view that ranks the fixes
Now you have reasons from three sources: the survey (what they say), the usage data (what they did), and the interviews (why). Turn that into a ranked, fixable list with a simple cohort table: for each reason_code, how many accounts, how much MRR, and how fixable it is this quarter. A reason that costs a lot and is cheap to fix goes to the top; two reasons that churn the same count can still differ wildly in whether they are your next sprint.
| Reason | Accounts | MRR lost | Fixable now | Owner |
|---|---|---|---|---|
| Never activated (dormant by week 2) | High | Medium | Yes (onboarding) | Product |
| Failed payment (involuntary) | Medium | Medium | Yes (dunning) | Billing |
| Too expensive for value seen | Medium | High | Partly (packaging) | Pricing |
| Missing integration | Low | High | No (roadmap) | Product |
| Project ended / no longer needed | Low | Low | No | None |
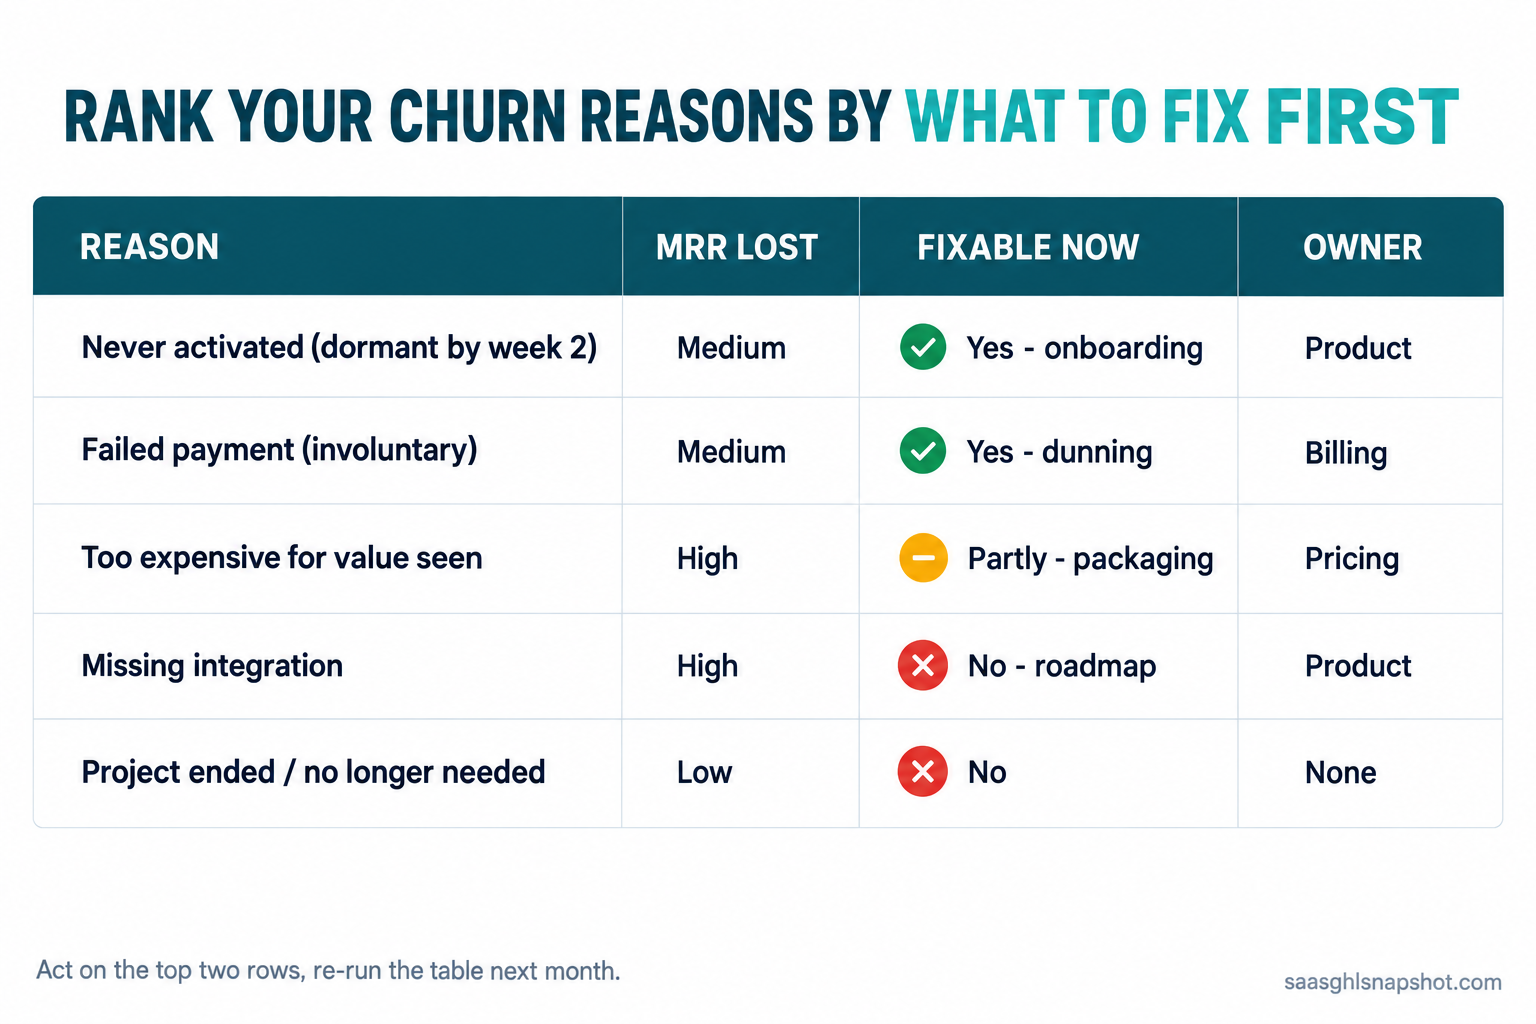
The research lands on the same few drivers: poor onboarding and weak product adoption dominate the first ninety days, with price sensitivity behind them. Your table will probably agree, but now with your own numbers. Act on the top two rows, re-run next month, and watch which one shrinks.
How it breaks: the table becomes a report nobody reads instead of a decision nobody can avoid. Put it in front of whoever owns the roadmap monthly and force one pick: which reason are we attacking this cycle.
Three scenarios: solo, five-person, fifteen-person
The system is the same at every size. What changes is how much you automate.
Solo founder, pre-$1M ARR. You are the instrumentation. Add the cancel survey to your billing tool (Stripe and most platforms have a native cancel-reason field), keep the six-column schema in a spreadsheet, and do every exit interview yourself, because those calls are the best product research you will get. Twenty minutes a week, and three saved accounts makes the month.
Five-person team, $1-3M ARR. Automate the boring parts. The failed-payment split and dunning run without you, the cancel survey writes its reason_code into your CRM, and one person owns exit interviews, five a month. The cohort table gets reviewed monthly and the top reason becomes an owned action. This is where a done-for-you GoHighLevel build earns its keep, because wiring billing, CRM, and usage events together by hand eats a developer week you do not have.
Fifteen-person team. The pipeline is automated and you are into segmentation, slicing reasons by plan, channel, and bootstrapped versus venture-backed buyer behavior, where enterprise and self-serve churn have different causes. The risk flips here, so much data you stop reading it, so keep the monthly ranked table as the forcing function.
Instrumenting churn without breaking privacy law
If any signups come from the EU or UK, GDPR applies the moment that data lands, so usage tracking needs a lawful basis and a line in your privacy policy, and CCPA and CPRA give California users rights to know and delete, including across your usage store. The win-back emails you send after diagnosis are commercial messages, so CAN-SPAM applies: accurate subject lines, a real physical address, and a working unsubscribe you honor fast, because a sloppy win-back becomes a spam complaint that hurts deliverability for everyone else.
Objections
“We are too small to instrument churn, we only lose a couple of accounts a month.” That is when it is cheapest and most valuable. Two a month is twenty-four a year, and you can interview every one.
“We already have a churn number in Stripe or ChartMogul.” You have the rate, which is stage zero. None of these tools tells you why without the survey, usage events, and interviews on top. The number is the smoke alarm; this system finds the fire.
“Exit interviews feel awkward and nobody will take the call.” More will than you expect, because you are the only vendor who ever asked. A 20 percent response rate at five churns a month is a conversation a week.
“Won’t tracking product usage feel creepy?” Not if you track value events on accounts you already bill and disclose it in your privacy policy. You are noticing that a paying account stopped using what they pay for, which is basic duty of care, not surveillance.
The payoff
The founder who instruments churn can say, inside a month, “most of our churn never activated, a third is failed cards we were not retrying, and the expensive ones all miss the same integration.” That is a sprint plan, a dunning fix, and a roadmap call. A churn number you understand is a problem you can shrink, one ranked reason at a time.
Frequently asked questions
What does it mean to instrument churn?
It means building a repeatable system that captures why each customer leaves, not just how many: a precise churn-event definition, splitting involuntary from voluntary churn, a structured cancel-flow reason, usage events, exit interviews, and a monthly cohort table ranking reasons by MRR lost and fixability. The output is a prioritized list of real causes, not one rate.
What is a good monthly churn rate for B2B SaaS?
Median monthly churn stabilizes at 3 to 4 percent after product-market fit, with top-quartile operators at 1 to 2 percent, per ChartMogul's 2023 SaaS Benchmarks Report. Companies below roughly $300K ARR often run closer to 6 percent, which is normal and improves with activation.
What is the difference between voluntary and involuntary churn?
Voluntary churn is a customer who chooses to cancel; involuntary churn is one who still wants the product but whose payment fails, usually an expired or declined card. It is an estimated 20 to 40 percent of subscription losses and the most recoverable segment, because it needs working payment retries, not persuasion, so always split the two first.
How many exit interviews do I actually need?
Five to eight real conversations a month is enough to surface patterns at an early-stage company, because a human can ask the follow-ups a survey cannot. Pull the list at random from all churns, reach out within a week, and keep each call to fifteen minutes framed as research.
Which product usage events should I track to predict churn?
Start with three: your core value event (the action that is the point of your product), a team-expansion event (a second user or seat), and a week-two return. These separate accounts that never activated from accounts that activated then faded. Track value events, not vanity events like raw logins.
Do I need a data warehouse to instrument churn?
No. A solo founder can run the whole system with a spreadsheet, a native cancel-reason field in their billing tool, and a few tracked events. A small team can automate the split, survey, and cohort view inside one platform like GoHighLevel with no data engineering.
Related reading
- Churn prediction with health scores: the SaaS founder’s setup guide
- SaaS cancellation flow: how to save churn at the moment of cancel
- Failed-payment dunning: recover the revenue you are already owed
- SaaS win-back campaigns: how to reactivate churned customers
Sources
- SaaS Capital, 2026 Private B2B SaaS Company Growth Rate Benchmarks
- Benchmarkit, 2025 B2B SaaS Performance Metrics Benchmarks
- ChartMogul, SaaS Benchmarks Report (2023 edition)
- Recurly, failed payments could cost subscription companies more than $129 billion in 2025
- June.so, customer churn meaning and retention strategies in B2B SaaS
- FTC, CAN-SPAM Act compliance guide for business
- GDPR.eu, what is GDPR
- California Attorney General, California Consumer Privacy Act (CCPA)